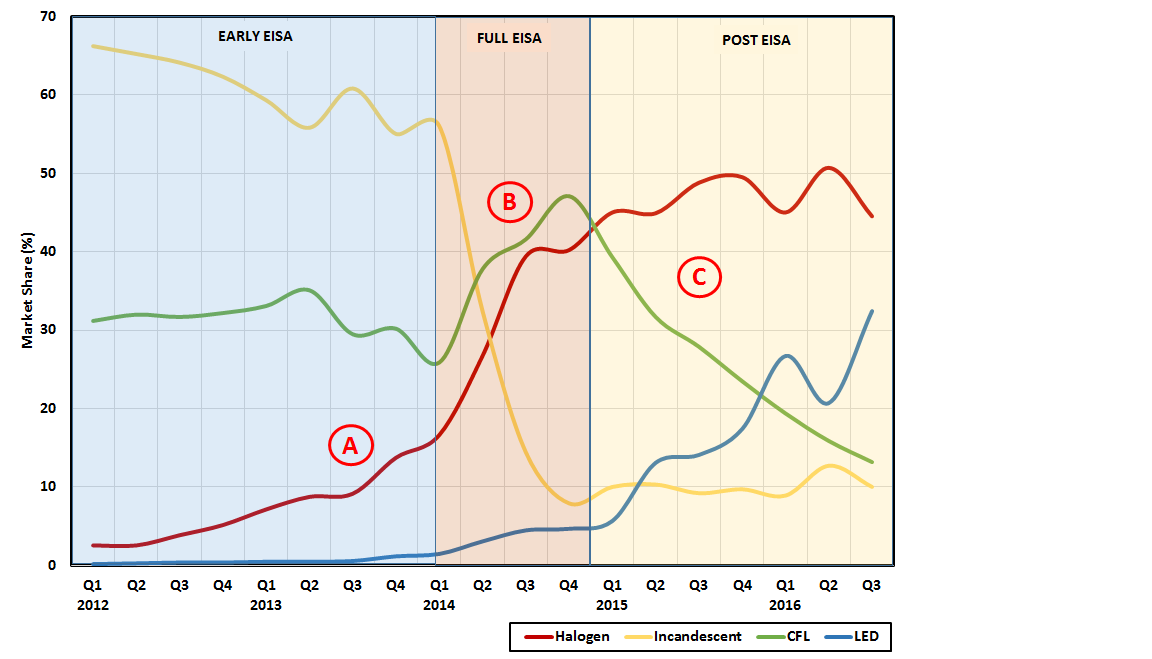
NEMA published 3rd Quarter 2016 general service lamp shipment data earlier today (see: http://www.nema.org/news/Pages/LED-A-Line-Lamp-Shipments-Increase-in-Third-Quarter-of-2016.aspx for the press release). To illustrate the market dynamics, I have graphed the NEMA market share information for each technology relative to each other (rather than the stacked column graph presentation from NEMA). I find it much easier to notice what is going on in the market using this approach. I have also identified three critical time periods for the general service lamp market – Early EISA, Full EISA, and Post EISA for illustration.
Data from: http://www.nema.org/Intelligence/Pages/Lamp-Indices.aspx
There are three interesting trends to note from these data…
A – In the early years of the EISA legislation (2012 & 2013, when 100 watt and 75 watt incandescent lamps were restricted), we saw a relatively small reduction in the overall market share of incandescent lamps (≈65% to 55%) and stronger growth (≈15%) in the EISA compliant halogen products that were introduced to the market to replace baseline incandescent lamps. It’s not surprising that the market share of incandescent lamps fell so marginally since 100 and 75 watt lamps make up a relatively small fraction of the overall incandescent market. However, many were surprised to see notable growth in the halogen lamps so early after their introduction, especially since they were roughly 4X the cost of incandescent lamps.
B – During 2014, as we began to see the full impact of the first tier of the EISA legislation market share of incandescent bulbs fell sharply from ≈55% down to 10%. Coincident with this reduction in incandescent bulbs, both CFLs and halogen saw strong growth during the year. Although LED lamps also grew during 2014, the high first cost of products limited their market share relative to the other technologies available in the market.
C – After the full implementation of the first tier EISA standards (2015 & beyond), the most striking market trend was the devastating decline in the market share for CFLs – falling from a maximum market share of 47% to 13% in seven quarters. During that time, LEDs captured most of the market share (from ≈6% to 32%) created by the declining CFL shipments, but halogen products also continued to gain market share.
So, as the market stood in the 3rd Quarter of last year, halogen products still held the majority market position at 44% followed by LEDs at 32%. One could reasonably expect that CFLs will continue to fall off in the subsequent quarters which will place another ≈10% market share in play. What will be interesting to see is how LED and halogen products compete throughout the remainder of this decade leading up to 2020 when the back-stop provision of the EISA legislation is likely to go into effect since the DOE was unable to finalize a new rule for general service lamps prior to the beginning of 2017. For more on that, see the docket folder for the rulemaking: https://www.regulations.gov/docket?D=EERE-2013-BT-STD-0051.
If you have questions about this or would like to discuss it further, please reach out to me directly: http://www.scsanalyticsllc.com/contact/.